 Cost per contact is the most important measure of efficiency in the contact
center. It is an easily derived metric that tells you how much you are
paying for one unit of work (one contact). If two contact centers perform
the exact same service, yet one has a cost of $7.00 per contact, and the
other has a cost of $5.00 per contact, the latter contact center is clearly
more efficient.
Cost per contact is the most important measure of efficiency in the contact
center. It is an easily derived metric that tells you how much you are
paying for one unit of work (one contact). If two contact centers perform
the exact same service, yet one has a cost of $7.00 per contact, and the
other has a cost of $5.00 per contact, the latter contact center is clearly
more efficient.
But how can we manage cost per contact, and more specifically, what are the
underlying drivers of cost per contact? Many productivity factors drive
cost, and one or more metrics can measure each of these productivity
factors. These are the metrics of contact center productivity.
Cost per Contact Defined
Cost per contact is the total annual operating expense of a contact center
divided by the annual inbound contact volume of the contact center.
Operating expense includes all employee salaries, overtime pay, benefits,
and incentive compensation, plus all contractor, facilities, telecom,
desktop computing, software licensing, training, travel, office supplies,
and miscellaneous expenses. Contact volume includes inbound contacts from
all sources: voice, email, web, chat, fax, and walk-in.
Contact centers are labor intensive. Approximately 70% of all contact
center costs are personnel related – salaries and benefits for those who
work in the contact center. Some contact centers will simplify the cost per
contact metric by including only personnel costs in the calculation. This
avoids the sometimes-tedious task of determining all of the non-personnel
costs.
We can further segment cost per contact into 1) cost per agent-assisted
contact, and 2) cost per contact for all contacts, including IVR and AI
(artificial intelligence). Let’s say, for example, that a regional bank
handles one million agent-assisted voice calls per year and spends $6
million annually on its contact center. The agent-assisted cost per contact
is simply $6,000,000 in operating expense ÷ 1,000,000 calls = $6 per
agent-assisted contact. Now, let’s assume that another 1 million contacts
are resolved each year in the banks IVR. In other words, 50% of all inbound
contacts are resolved in the IVR (a 50% IVR containment rate is about
average in retail banking). These IVR contained calls have no marginal
cost, so the total cost per contact, for all contacts including the IVR,
would be $6,000,000 in operating expense ÷ (1,000,000 voice calls +
1,000,000 IVR resolved calls) = $3 per contact.
The Drivers of Contact Center Productivity
Before we get into the specific metrics of contact center productivity,
let’s start by defining the key factors that drive cost per
contact. These factors can be roughly divided into four categories:
-
Agent productivity
-
Channel mix
-
Geography
-
Root cause elimination of contacts
Agent productivity is what most people think of when it comes to making the
contact center more efficient. However, it turns out that optimizing agent
productivity, by itself, often does very little to move the needle on cost.
By contrast, optimizing channel mix can sometimes have the effect of
reducing cost per contact by 50% or more.
Channel mix is simply the percentage of inbound contacts that arrive at the
contact center through various channels: voice, chat, email, web, IVR, AI,
and walk-up. As shown in the example above, deflecting contacts into the
IVR can have a significant impact on total cost per contact! This is why so
many contact centers devote substantial resources to optimizing their IVR
menus.
Wage rates drive cost in a labor-intensive function. As such, large contact
centers tend to be located in geographies that have lower wage rates. From
a cost perspective, it makes more sense to find a contact center in Des
Moines, Iowa than in New York City; or in Manila than in San Francisco.
Finally, contact centers are increasingly taking a page from IT Service
Management, and adopting the principles of Problem Management, an ITIL
discipline that focuses on the root cause elimination of contacts. Some
contact centers have been successful at eliminating up to 30% of their
annual contact volume through effective root cause analysis.
Let’s examine each of these productivity drivers in more detail.
Agent Productivity Metrics
The primary metrics of agent productivity are agent utilization, average
handle time (AHT), and contacts per agent per month.
Agent utilization
is simply the ratio of work produced divided by work capacity. So, for
example, if an agent is on customer calls for five hours out of an
eight-hour shift, the utilization for that agent that day would be 62.5% (5
hours of work produced ÷ 8 hours of work capacity).
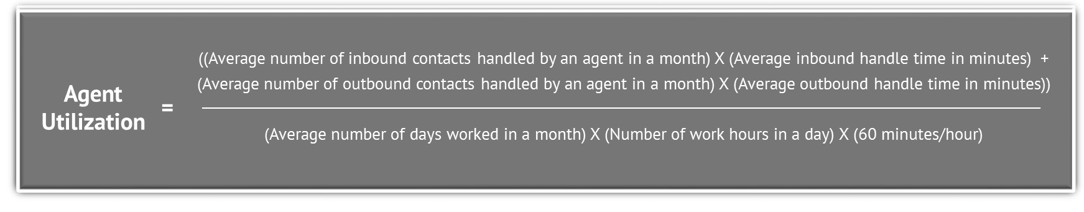
The formula for determining agent utilization is somewhat complicated. It
factors in the hours in a workday, breaks, vacation and sick days, training
time and a few other variables. But there is an easy way to approximate
agent utilization without going to so much trouble. Here is the simplified
formula:
Let’s say, for example, that the agents in a particular contact center desk
handle an average of 375 inbound contacts per month at an average handle
time of 10 minutes per contact and make 225 outbound contacts per month at
an average handle time of 5 minutes per contact. Additionally, these agents
work an average of 21.5 days per month, and their workday is 7.5 hours
after subtracting lunch and break times. The simplified utilization formula
above would work out to the following:
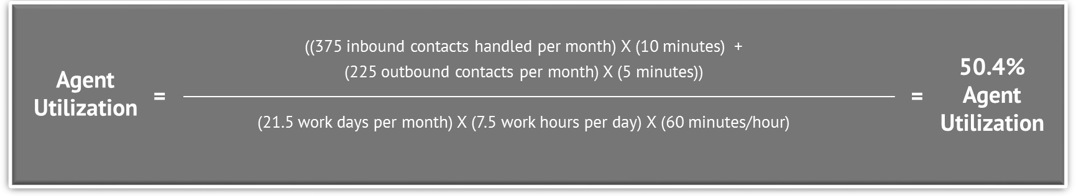
Once again, this is not a perfect measure of agent utilization, but it is
quick and easy and gets you within 5% of the true agent utilization figure.
When utilization is low, the cost per agent-assisted contact will be
higher. This could be an indication that the contact center is
over-staffed, that schedule adherence is low, or that workforce scheduling
could be improved. Conversely, when agent utilization is high, cost per
agent-assisted contact will be lower.
Average Handle Time
(AHT) is the average time that an agent spends on an inbound contact,
including talk time, chat time, wrap time, and after call or after chat
work time (ACW). For non-live contacts, such as email and web submitted
inquiries, the contact handle time is the average time that an agent spends
working on a contact before escalating or resolving the contact.
A contact is the basic unit of work in a contact center. Average handle
time, therefore, represents the amount of labor required to complete one
unit of work. Additionally, it is an indirect measure of contact
complexity. As an example, a balance inquiry to a credit card contact
center might have a handle time of two or three minutes. By contrast, a
call to an insurance company to purchase an auto insurance policy might
have a handle time of 20 minutes or more.
For obvious reasons, cost per contact increases as handle time increases.
As such, many contact centers focus on handle time, and specifically handle
time reduction, as a means to reduce cost per contact. AHT can be reduced
in a number of ways including agent training, scripting, and certain
technologies such as screen pops, CRM, and knowledge management. In some of
the industry’s largest contact centers, even a handle time reduction of 10
or 15 seconds, when multiplied across hundreds of millions or even billions
of contacts per year, can yield huge savings!
Contacts per Agent per Month
is the average monthly inbound contact volume divided by the average
Full-Time Equivalent (FTE) agent headcount in the contact center. Contact
volume includes contacts from all agent-assisted channels: voice, chat,
email, web submitted inquiries, walk-in, etc. Agent headcount is the
average FTE number of employees and contractors handling customer contacts.
Contacts per Agent per Month is an important indicator of agent
productivity. A low number could indicate low agent utilization, poor
scheduling efficiency or schedule adherence, or a higher-than-average
handle time. Conversely, a high number of inbound contacts per agent per
month may indicate high agent utilization, good scheduling efficiency and
schedule adherence, or lower-than-average handle time.
Channel Mix Productivity Metrics
Channel mix in the contact center is rapidly evolving (Figure 1 below) and
is considered one of the industry’s megatrends. In 2008 voice calls
represented almost 80% of all contact volume. Today, voice accounts for
just over 50% of incoming contact volume.
There are two key drivers behind this trend. One is economic, and the
second is demographic. The key economic driver is that voice, which has
dominated the industry for decades, is one of the most expensive channels,
while chat, email, web, and especially IVR and AI are all lower cost than
voice.

IVR and AI contacts are lower cost than voice contacts for obvious reasons.
But it’s not so obvious why chat, email, and web submitted contacts are
lower cost than voice. Since voice is a real-time channel, the Erlang
distribution of incoming calls tends to be very spiky. This, in turn, makes
it challenging to staff the voice channel efficiently. The voice channel is
perpetually either understaffed or over-staffed! Chat is also a real-time
channel, but an effective chat agent can often handle two or more
concurrent sessions, thereby making chat more efficient than voice. In
fact, MetricNet’s benchmarking data shows that the average contact resolved
in chat costs just 76% as much as a contact resolved in the voice channel.
Email and web submitted contacts tend to be lower cost than voice contacts
because these channels do not have the same real-time urgency as voice and
are therefore less spiky than voice and chat. This makes it easier to staff
email and web channels, which leads to better agent utilization and lower
costs. On average, the cost of an email or web-submitted contact is about
81% of the cost of a voice contact.
What about the demographic drivers behind channel mix? If you look at a
spectrum of customers – from those who are just entering the workforce, to
those nearing retirement – younger customers tend to prefer self-help (IVR
and AI) or the indirect channels of chat and email, while those who have
been in the workforce for some time rely much more heavily on live voice as
their go-to contact center channel. This trend will continue as newer
workers enter the workforce.
What is the right channel mix, and how does a contact center achieve that
state? The answer depends upon the unique nature of the services provided
by your contact center. It would be tempting to suggest that the ultimate
channel mix is to drive all contacts into the IVR, thereby eliminating all
costs associated with voice, chat, email, and web support. But this is
neither realistic nor wise. Many contacts simply cannot be resolved in the
IVR, and many customers would prefer to interact with a live agent rather
than an IVR.
There are, however, better end states for channel mix, and less optimal end
states for channel mix. The following principles guide the contact centers
that come closest to truly optimizing their incoming channel mix. First,
they ensure that customers have a great experience regardless of which
channel they choose. Offering chat might sound good, but a poorly
implemented chat channel can harm both the customer and the reputation of
the contact center. Secondly, they never force a customer into a particular
channel. Instead, they give them incentives to use lower cost channels. Two
examples come to mind here.
Every voice or chat session should be viewed as an opportunity to educate
the customer. If you simply resolve a caller’s issue without providing a
re-usable solution, they will contact you again and again with the same
issue. This is akin to the “give them a fish vs. teach them how to fish”
allegory. If you can teach a caller how to resolve some of their own issues
quickly, you can reduce overall contact volume while simultaneously
empowering the customer. This could be as simple as pushing a knowledge
article to the caller or walking the caller through a co-browsing session
to perform a transaction on your website. A second common practice is to
play a wait time message when the voice channel is experiencing heavy
volumes. Sharing simple information such as the expected wait time and a
URL for chat, email, or self-help support can encourage trials and
ultimately adoption of a new (lower cost) channel by the customer.
Finally, they minimize costs, consistent with principles one and two. In
other words, they are proactive about driving contacts into lower cost
channels, but they never override the will of the caller or sacrifice the
customer experience in doing so.
Channel mix will continue to evolve for many years to come. Voice is
decreasing as a percentage of all incoming contacts, while chat, web, IVR,
and AI are all on the rise. There are both economic and customer experience
benefits to be had by proactively managing this evolution. Customers can
and should be encouraged to use lower cost channels, but never at the
expense of the customer experience.
The Productivity Metrics of Geography
Cost per Contact is a function of geography due to wage rate differentials.
For a labor-intensive function, any reduction in wage rates will have the
effect of reducing the cost of agent-assisted contacts. To follow up on a
prior example, if entry-level contact center agents in New York earn
$45,000 per year, while entry-level agents in Des Moines earn $30,000 per
year, the agent-assisted cost per contact will decrease in proportion to
the wage rate difference if the contact center is moved from New York to
Des Moines.
Take the case of an insurance claims contact center in New York that is
spending $30 per inbound contact. The same contact center would spend just
$20 per contact in Des Moines (($30k salary in Des Moines ÷ $45k salary in
New York) X $30 per inbound contact in New York) = $20 per inbound contact
in Des Moines. This simple calculation assumes that all non-personnel costs
will also decrease in proportion to the wage rate differential, which is,
roughly speaking, a valid assumption.
The proliferation of offshore contact centers since the mid-1990s is a
direct reflection of the wage rate differential between higher wage
countries in Europe and North America vs. lower-wage countries in southeast
Asia and elsewhere. To continue with our example, and just by way of
illustration, we could reduce costs still further by moving our claims
contact center from Des Moines to Manila. The average contact center agent
in Manila makes about $5,000 per year. So, our $20 cost per contact in Des
Moines would become just $3.33 per contact in Manila (($5k salary in Manila
÷ $30k salary in Des Moines) X $20 per inbound contact in Des Moines) =
$3.33 per inbound contact in Manila.
The Productivity Metrics of Root Cause Analysis
In information technology, there is a practice called Problem Management.
The idea behind problem management is to eliminate the underlying drivers
of incidents that generate support calls to the service desk. Some
companies have been successful at reducing their ticket volumes by 50% or
more through problem management.
By the same token, contact centers that engage in root cause analysis
endeavor to identify the key drivers of contact volume. By focusing on the
underlying drivers of contacts, it is often possible to reduce volume
significantly. For example, one financial services company sought to reduce
the number of agent-assisted password reset calls by adopting a
bio-recognition password tool for voice and fingerprints. Within a year the
volume of password reset requests decreased by almost a third, and overall
volume was reduced by approximately 2.5%. This may seem like a modest
improvement, but for this particular contact center, which handles more
than a billion consumer calls a year, the reduction in agent-assisted
password reset calls alone saved them tens of millions of dollars.
The productivity metric for root cause analysis is the decrease in contacts
per customer, month-over-month and year-over-year. One major gas and
electric utility redesigned their monthly billing statement to make it
easier for their customers to understand. Additionally, they began pushing
text and voice messages to customers who were affected by outages. The
combined impact of these two actions reduced the annual contact volume per
customer from 1.26 calls per year to 1.14 calls per year. For this
particular utility, who had several million customers, the net effect was a
decrease of almost a million calls per year and a savings of more than $7
million a year!
Maximizing Contact Center Productivity
As a 30-year veteran of this industry, I have seen contact centers struggle
more often than not with cost containment. Many times, these contact
centers do not understand the connection between productivity and cost, or
they view productivity too narrowly, strictly in terms of agent efficiency
and utilization. By viewing productivity more broadly, as any factor that
impacts cost, it is possible to open up new avenues of productivity
improvement. Some of these productivity factors – including channel mix,
geographic location, and root cause analysis – have the potential to reduce
the overall cost of your contact center dramatically.